
Sign up to save your podcasts
Or

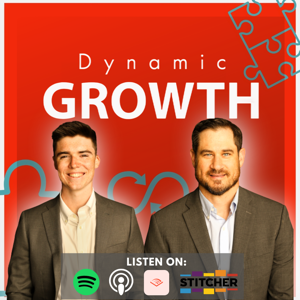


We feel we have only brought negative news in the past few episodes so we wanted to switch up the tone. We only wanted to share positive news and information during this episode. We discuss positive news in our personal lives and some things we are looking forward to, hopefully, the episode is viewed as a nice change of pace from all of the negativity constantly surrounding us.
As the glory days of free money come to an end (for now), we are fielding a lot of questions about how to protect investments in a down market. Since January, we've watched a steady decline, and even if you aren't heavily invested in the stock market, you are being hit hard at the gas pump, in the grocery store, wherever you go – you name it, it's unavoidable!
Today we're talking about your 401k investment strategy and giving tips for riding out a bear market
Target date funds have been getting some press lately thanks to a recent study by Bank of America. Unfortunately for target-date funds, this study is poking some holes in the fundamental way these funds operate. Bottom line, as an investor you should 1. know if your 401k uses target-date funds and 2. give us a call so we can help you analyze performance.
For those of you that listen to the podcast (vs just reading our summaries), notice anything new this week? Maybe the intro music! We thought it was time to change it up a little – hope you like it!
Today we're sharing predictions from the recent World Economic Forum, Derek gives the latest updates on Crypto, and Nate discusses an interesting new investment opportunity.
Special Guest Carly Snyder and Malery Sloan take over this week to give insight on social media and marketing. Both have extensive experience in advising clients and Malery brings particular expertise in the realm of social media. We thank her for joining us today and look forward to the next episode.
Have you ever watched something happen and it almost feels like it's in slow motion? You know what's going to happen but there's really nothing you can do to change the course. Sound familiar? It's exactly how we feel when it comes to the market and listening to the most recent earnings reports from major retailers was yet another example of the bear market at work.
In the most recent Fed meeting, the message was clear – continue with the status quo. As we watch the controlled demolition of the stock market transpire, we can't help but remind ourselves that this was the plan. The Fed has stated they want to tame inflation by slowing down the economy through interest rate increases. The tone has changed from the last time the Fed met, however, with a new emphasis on raising interest rates until prices stabilize to 2% of inflation or until something breaks.
The lightning network is a second layer of technology on top of Bitcoin. It was developed in 2015 to try and solve the major critiques of Bitcoin – it has 10-minute transaction times and lacked global transactional reach. An easy way to think about the role the lightning network plays is the example of cash and gold. The primary goal of cash was to improve the monetary system and make it easier to transact between people and businesses. Sounds a lot like the role banks play – the banks are there to validate the transactions and make sure the money is exchanged.
Most stocks are evaluated using PE ratios but we caution you to use those same criteria for banks – here's why! Earnings statements! Banks make money by lending and that is largely influenced by interest rates. They also prepare for losses – meaning they evaluate if they feel confident whether people can / cannot pay loans back. Both of those reasons can lead to a sudden increase or decrease in earnings, depending on what is happening in the market.
Today we talk about famous investor Bill Ackman and his 400M dollar loss on Netflix's stock. We also discuss Elon's purchase of Twitter for $44B and Nate gives his thoughts on what is actually meant by "risk". Lastly, we talk about what it would take to give us a breather in a tough market.
Nate, Derek, and Macy are discussing questions that new investors are likely to ask and we give our different perspectives. We recorded Investing 101 in 2020 but felt we could go even more fundamental with the questions. We hope you learn something and enjoy the podcast.
Carly is back on the podcast to discuss her recent trip to Disney World. On the trip, Nate couldn't help but look at all the small details of branding that are scattered across the park. We discuss Disney as a brand, and how customers come to form opinions about the quality of a product or service.
Yield Curve and The VIX
The inverted yield curve has predicted a recession 22 times since 1900. Today we'll break down the key indicators used to measure market volatility, including the yield curve and the VIX index.
A yield curve plots treasury bonds at 3, 6, and 12 months, as well as 2, 5, 10, and 30 years. When the yield curve inverts, often a recession will follow in the next 6-24 months. Historically you expect that longer duration bonds will pay more than shorter – money today is worth more than in the future – so if the yield curve inverts it's an indicator that a recession may be on the horizon.
The inverted yield curve has predicted every recession since 1955, and in fact it has inverted 28 times since 1900 and 22 of those times a recession has followed. However, keep in mind that while it has predicted every recession, it has also given multiple false warnings. From our point of view, as long as publicly-traded company earnings continue to be solid, we'll maintain our position in the market.
So what? Well, as of April 1, 2022 the yield curve has some inversions. The 5 & 10 year have inverted, the 5 & 30 year, as well as the 2 & 10 year. This is the first time we've seen this since 2019. Does this mean a recession is coming? Maybe yes, maybe no.
Now let's look at the VIX – also known as the Fear Index. The VIX provides a real-time market index to measure volatility for the next 30 days. A number is assigned by using a complex mathematical formula and if that number is under 20 then it predicts a period of low volatility, while over 20 forecasts an increased level of volatility. As of April 1, 2022 the VIX is at 19.53.
What does all this mean? Investors can and should use these market indicators to make educated decisions about their investments. Some investors – called contrarian – will buy when the VIX is above 20 and sell / hold when it's below 20. The average investor might use the VIX to decide when to enter the market with new investments. If you are risk averse and the VIX is low you may want to put more money in at a faster rate or alternatively if the VIX is high maybe you act slower.
At Crosby Advisory we research and watch these indicators literally every day. Over time, we have moved many of our portfolio durations to 5 years and under – that way we are less impacted by interest rate increases. If you are investing on your own, always be sure to do your homework! Remember there is a fine line between reactive and not reactive enough.
In the podcast we referenced Investopedia – here is the link. https://www.investopedia.com/
Ray Dalio on diversification https://www.youtube.com/watch?v=Nu4lHaSh7D4
From the publisher's feed
227,633 Listeners

30,578 Listeners
3,161 Listeners

3,317 Listeners

112,256 Listeners

1,414 Listeners

8,362 Listeners

4,027 Listeners

557 Listeners

211 Listeners

18,920 Listeners
1,441 Listeners