
Sign up to save your podcasts
Or

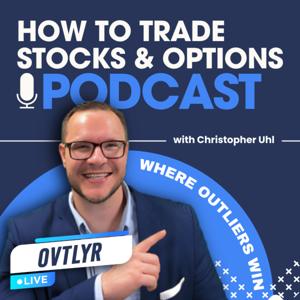


The market is up big today… but does that actually mean the bull market is back? SPY and QQQ are both pushing higher, yet this market has spent weeks bouncing back and forth inside the same range. One green candle can create a massive amount of FOMO, but when you zoom out, price is still sitting near levels we saw only days ago.
And that's the problem with a “kangaroo” or pinball market. It jumps up, falls down, jumps up again, and makes traders feel like they're constantly missing something. These are some of the hardest conditions to trade because there isn't a clean trend to sit in. Instead, traders get tempted into chasing every short-term move.
The trend template is technically bullish. The 10 EMA is above the 20 EMA and price is above the 50 EMA. But market breadth tells a very different story. Every single sector still has bearish breadth, the number of stocks in uptrends has been falling, downtrends have been increasing, and only about 18% of the market currently has buy signals.
That's why one of the biggest lessons in this episode is simple: when there's nothing to trade, sitting in cash is still a position. Trying to catch every little move can drain an account before the real opportunity ever arrives. Energy and materials are the only sectors showing positive weekly and monthly performance, and even those come with serious problems. Materials continues to see increasing sell signals, while energy carries significant geopolitical catalyst risk.
Instead of forcing trades, we're using this period to build better trading plans. SPY and QQQ are beginning to develop into different strategies, with the focus shifting beyond pure expectancy toward something just as important: whether a trader can actually stick with the plan.
That leads into the “Emotional Comfort Score” or sleep-at-night score. We're looking for strategies that combine strong expectancy with bigger winners, smaller losers, higher win rates, better trade frequency, and reduced drawdowns. The goal isn't necessarily to capture every last dollar of upside. Sometimes giving up some upside in exchange for dramatically smaller downside can create a plan that's easier to execute consistently.
Capital efficiency is another major part of the research. Deep-in-the-money SPY options around 75 delta may allow a relatively small percentage of the account to replicate exposure that would otherwise require a much larger position in leveraged ETFs. Rolling options could also allow profits to be taken off the table while keeping the underlying trade alive.
✅ SPY, QQQ, and the current “kangaroo market”
✅ Market breadth, trend templates, and why one green day isn't enough
✅ Sitting in cash and avoiding FOMO-driven trades
✅ Expectancy, win rate, drawdowns, and the Emotional Comfort Score
✅ Deep ITM options, capital efficiency, rolling, and new trading plans
If you've ever watched the market rip higher for one day and felt like you HAD to jump back in… this one is worth watching. A green candle doesn't automatically mean conditions are good. Sometimes the best trade is waiting until the evidence actually supports taking risk again.
Subscribe to OVTLYR for disciplined trading strategies that actually make sense. 👉 https://www.youtube.com/@ovtlyrdotcom
#StockMarket #SwingTrading #OVTLYR #SPY #QQQ #MarketBreadth #TradingStrategy #OptionsTrading #RiskManagement #TechnicalAnalysis #TradingPsychology #FOMO
Are you looking to save time, make money, and start winning with less risk? Then head to https://www.ovtlyr.com.
Learn more about OVTLYR: https://youtu.be/TUCbD5Kovlc
Finding winning stocks sounds simple, right? Find the next big mover, jump in, and ride it higher. But what happens when you get it wrong?
This video breaks down a very different way to think about swing trading, momentum, market sentiment, risk management, and finding where the money is actually flowing.
The biggest takeaway? You don't need to predict the future. You need a plan, a positive edge, and the discipline to get out when the trade stops working.
Here are a few key ideas:
✅ Don't chase the hottest stock after everyone is already talking about it
✅ Look for strong trends and increasing volume
✅ Know exactly where you'll get in and where you'll get out
✅ Keep your risk small enough that one bad trade doesn't destroy your account
✅ Follow where money is flowing instead of getting trapped in social media noise
✅ Be rigid with your plan, but flexible with the outcome
From AMD, Palantir, SoFi, Tesla, and Big 5 Sporting Goods to the 10/20/50 trend setup, this gets into what separates a calculated trade from simply saying, "trust me, bro."
If you're trying to find better stock trading opportunities while managing risk, there's a lot to take away here.
👉 https://www.youtube.com/@ovtlyrdotcom
📌 Video: https://youtu.be/tDUFAlFRShM
#StockMarket #StockTrading #SwingTrading #Investing #TradingStrategy #StockMarketTips #RiskManagement #MomentumTrading #OVTLYR
Here's how we plan to DOMINATE the US Investing Championship for 2026
You can see our step by step trading plan developed by a team of over 20 quants for FREE by clicking here: https://www.ovtlyr.com/usicplan
Are you looking to save time, make money, and start winning with less risk? Then head to https://www.ovtlyr.com.Learn more about OVTLYR: https://youtu.be/TUCbD5KovlcEnergy is suddenly doing something almost no other sector is doing… while every major sector has been negative over the last week, energy is standing alone in positive territory. Add in a major new U.S.-Venezuela oil agreement, and there are some very interesting developments happening underneath the surface.But here's the part that matters: just because a sector is strong doesn't mean you have to trade it. Energy is improving, buy signals are increasing, and more stocks are moving into uptrends. At the same time, market breadth is still bearish, SPY has flashed another sell signal, and geopolitical catalyst risk can completely change a trade overnight.The Sector Intelligence Map gets a deep dive as energy emerges as the strongest sector over the last week and one of the strongest over the last month. From there, we drill into oil and gas exploration and production, equipment and services, integrated oil companies, refining and marketing, and other energy industries to see if that strength is producing actual opportunities.Chevron is already showing what a strong trend can look like, while BP, AR, and TS make it through the screener. But the charts tell very different stories. BP raises an important question about gap risk and changing stock character. AR shows a much smoother trend with room before hitting another major order block. TS becomes a useful example of market-cycle stages and what happens when a stock starts transitioning between trends.The Venezuela oil deal adds another layer. The Energy Secretary discusses increasing Venezuelan production, encouraging private investment, and potentially putting downward pressure on global oil prices. Venezuela holds enormous reserves but produces only a fraction of what it once did, meaning any meaningful increase in production could have implications across the global energy market.And that's where risk management comes back into the picture. Despite the technical strength in energy, I'm staying completely out of the sector while geopolitical uncertainty remains elevated. Iran and the broader Middle East create catalyst risk that I simply don't want in the portfolio. The opportunity may be real, but missing a trade is perfectly acceptable when the risk can't be quantified.✅ Energy sector strength and where money is currently flowing✅ Venezuela oil deal and potential pressure on global oil prices✅ Chevron, BP, AR, and TS stock analysis✅ Sector Intelligence Map, breadth, buy signals, and order blocks✅ Gap risk, market cycles, catalyst risk, and knowing when NOT to tradeIf you've ever found a stock that looked great technically and wondered why you shouldn't take the trade… this one is worth watching. Finding an opportunity is only part of trading. Knowing when the surrounding risk makes that opportunity not worth taking can be just as important.Subscribe to OVTLYR for disciplined trading strategies that actually make sense. 👉 https://www.youtube.com/@ovtlyrdotcom#StockMarket #SwingTrading #OVTLYR #EnergyStocks #OilStocks #Chevron #CVX #Venezuela #OilMarket #SectorRotation #MarketBreadth #TradingStrategy #TechnicalAnalysis #CatalystRiskHere's how we plan to DOMINATE the US Investing Championship for 2026You can see our step by step trading plan developed by a team of over 20 quants for FREE by clicking here: https://www.ovtlyr.com/usicplan
Are you looking to save time, make money, and start winning with less risk? Then head to https://www.ovtlyr.com.Learn more about OVTLYR: https://youtu.be/TUCbD5KovlcThe stock market is setting up for a potentially HUGE move — and the signals are getting harder to ignore.In today’s market breakdown, we’re looking at what’s happening beneath the surface, where money is rotating, and the stocks that could be positioned for the next major move.We’ll break down:📊 What the latest market signals are telling us🚨 The warning signs traders need to watch🔥 Where strength is starting to emerge💰 The stocks and sectors attracting attention📈 What needs to happen next for bulls and bears🎯 The setups we’re watching going into the next trading sessionThe market may be approaching an important inflection point. The question isn’t just whether it moves — it’s whether you’re positioned BEFORE everyone else sees it.Watch until the end so you know exactly what we’re watching next.#StockMarket #Stocks #Trading #Investing #DayTrading #SwingTrading #MarketAnalysis #SPY #QQQ #OptionsTradingHere's how we plan to DOMINATE the US Investing Championship for 2026You can see our step by step trading plan developed by a team of over 20 quants for FREE by clicking here: https://www.ovtlyr.com/usicplan
Are you looking to save time, make money, and start winning with less risk? Then head to https://www.ovtlyr.com.
Learn more about OVTLYR: https://youtu.be/TUCbD5Kovlc
If options trading still feels like a bunch of confusing numbers, Greeks, and formulas, this deep dive is going to make things click.
We’re breaking down the Option Greeks for beginners and showing why understanding them can completely change the way you look at an options chain.
Here’s what we get into:
✅ Delta: how much an option can move when the stock moves $1, plus how delta can help estimate the chance of expiring in the money.
✅ Gamma: the “acceleration” of delta and why your option can become more sensitive as the trade moves in your favor.
✅ Theta: how time decay eats away at extrinsic value as expiration gets closer.
✅ Vega: how implied volatility impacts option prices and why deep in-the-money options can reduce your exposure to volatility.
But the real game changer? Rolling winning options to take partial profits, reduce risk, free up capital, and keep the position alive instead of cutting your biggest winners too early.
We also break down intrinsic vs. extrinsic value, capital efficiency, position sizing, leverage, and why deep in-the-money options can behave much more like stock.
If you want to trade options with more confidence and actually understand what those Greeks are telling you, this one is worth watching.
👉 https://www.youtube.com/@ovtlyrdotcom
📌 Video: https://youtu.be/SFebmSYSZA8
#OptionsTrading #OptionGreeks #StockMarket #Investing #Options
Here's how we plan to DOMINATE the US Investing Championship for 2026
You can see our step by step trading plan developed by a team of over 20 quants for FREE by clicking here: https://www.ovtlyr.com/usicplan
Are you looking to save time, make money, and start winning with less risk? Then head to https://www.ovtlyr.com.
Learn more about OVTLYR: https://youtu.be/TUCbD5Kovlc
What are the hottest stocks on Wall Street Bets right now, and are any of them actually worth your money?
That’s the big question in this video. We’re breaking down some of the biggest names people are watching, including Tesla, Micron, Nvidia, Amazon, Google, Meta, Apple, and Broadcom, using OVTLYR’s trading intelligence to see what the data is really saying.
And here’s the catch: just because a stock has a buy signal doesn’t mean it’s automatically a buy.
✅ Market trend and signals
✅ Breadth across thousands of stocks
✅ Fear and greed levels
✅ Sector strength and weakness
✅ Where Tesla, Apple, Micron and others really stand
Right now, the market is anything but easy. Around 80% of the market is showing sell signals, breadth is weak, and every sector is dealing with bearish conditions. That changes how you should look at individual stocks.
So which stocks actually stand out?
Tesla and Apple make the shortlist, while several other popular names simply aren’t showing enough strength yet. And sometimes, the smartest move isn’t chasing a trade. It’s sitting in cash and waiting for the market to give you a better setup.
👉 https://www.youtube.com/@ovtlyrdotcom
#StockMarket #Investing #Trading #Tesla #Apple #Nvidia #Micron #OVTLYR #StockAnalysis #TradingSignals #WallStreetBets #MarketAnalysis
Here's how we plan to DOMINATE the US Investing Championship for 2026
You can see our step by step trading plan developed by a team of over 20 quants for FREE by clicking here: https://www.ovtlyr.com/usicplan
Are you looking to save time, make money, and start winning with less risk? Then head to https://www.ovtlyr.com.Learn more about OVTLYR: https://youtu.be/TUCbD5KovlcSector rotation can happen faster than most traders realize… materials can take the lead, energy can suddenly become number one, communications can briefly take over, and then money can move straight into technology. The interesting part? You don't need to predict where it's going next. You can simply watch what's ranked strongest right now and follow the rotation as it happens.There's a part in here that really hits. Looking backward makes sector rotation seem obvious. Of course you can see where the money moved after the fact. But you couldn't see the future while it was happening. That's why looking at which sectors are ranked number one today can be so powerful. It gives you information without introducing hindsight bias.The Sector Intelligence Map is a huge part of this conversation. Materials, energy, and consumer discretionary are currently showing up near the top, but that's only the beginning. The real opportunity comes from drilling deeper into the strongest sectors, then looking at industries and eventually individual stocks. The idea is to follow where the money is actually flowing instead of trying to guess where it will go next.Plan M and Plan ETF also get a close look. With no sector currently showing the required sector relative greed condition for Plan M entries, the focus shifts toward finding other opportunities. Information technology, industrials, and materials are showing growth across different timeframes, with electronic components, computer hardware, and software infrastructure standing out as areas to investigate further.And there's some real trading happening too. Plan ETF gets put on with a full position in QQQ, while paper trades are being used to test new Plan M theories. The discussion gets into the 10/20 cross, why entering closer to an exit signal can mean taking less risk, order blocks, value zones, and how the paper trades are being treated as if they were real positions.The historical sector rotation example is especially interesting. Materials led during the silver and gold run, then energy took over, communications briefly moved to the top, and money eventually rotated into technology. The bigger lesson is that trends don't happen in a single day. Watching the weekly and monthly rankings can give you a much clearer picture of where the rotation is actually happening.✅ Sector rotation and identifying where money is flowing✅ Sector Intelligence Map and ranking sectors without hindsight bias✅ Plan ETF, QQQ, Plan M, and paper trading✅ Information technology, industrials, materials, and emerging industries✅ 10/20 cross, order blocks, value zones, and trading opportunitiesIf you've ever looked at a sector after it already exploded higher and thought, “I should've seen that coming”… this one is worth watching. You can't see the future, but you can see what's leading today. And sometimes that's all the information you actually need.Subscribe to OVTLYR for disciplined trading strategies that actually make sense. 👉 https://www.youtube.com/@ovtlyrdotcom#StockMarket #SwingTrading #TradingStrategy #OVTLYR #PlanETF #PlanM #SectorRotation #SectorIntelligence #QQQ #Nasdaq #TechnicalAnalysis #MarketAnalysis #TradingDiscipline #InvestingHere's how we plan to DOMINATE the US Investing Championship for 2026You can see our step by step trading plan developed by a team of over 20 quants for FREE by clicking here: https://www.ovtlyr.com/usicplan
Are you looking to save time, make money, and start winning with less risk? Then head to https://www.ovtlyr.com.
Learn more about OVTLYR: https://youtu.be/TUCbD5Kovlc
What if the biggest stock market winners were actually giving you clues before the breakout happened?
That’s exactly what we’re digging into today.
We’re breaking down the Callimachi breakout strategy and testing it against the top 100 stock market gainers. And the results are seriously interesting.
The big idea? Stop staring at charts after the move and start asking what the stock looked like BEFORE it exploded.
Here’s what we’re looking for:
✅ Strong momentum and a major move higher
✅ Price holding the 10, 20, and 50 EMAs
✅ Higher lows and tight consolidation
✅ Narrowing price action before the breakout
✅ Breakouts backed by momentum and volume
We also look at real examples including Nvidia, AMD, Celsius, and other explosive winners, plus how order blocks, overhead resistance, market trends, and sector strength can stack the odds in your favor.
And here’s the part that really caught my attention: the study found 58 clean setups among the top 100 performers, with an average risk of 3% versus an average return of 62%.
But finding the setup is only half the battle. The real challenge is having the discipline to let your winners run.
If you want to become a better trader, this one is worth watching.
👉 https://www.youtube.com/@ovtlyrdotcom
📌 Video: https://youtu.be/chCg-Q_lOfY
#StockMarket #Trading #SwingTrading #BreakoutTrading #StockTrading #Investing #TechnicalAnalysis #TradingStrategy #OVTLYR
Here's how we plan to DOMINATE the US Investing Championship for 2026
You can see our step by step trading plan developed by a team of over 20 quants for FREE by clicking here: https://www.ovtlyr.com/usicplan
Are you looking to save time, make money, and start winning with less risk? Then head to https://www.ovtlyr.com.Learn more about OVTLYR: https://youtu.be/TUCbD5KovlcAI is everywhere right now… but what happens when the technology powering the AI boom starts running into real-world limits? This conversation takes a deeper look at the AI bubble debate, and the biggest risks might have less to do with the technology itself and more to do with power, chips, competition, and expectations.There’s a part in here that really hits. AI needs two critical things to keep scaling: chips and electricity. And while the US is pouring massive amounts of money into data centers and AI infrastructure, the power needed to support that growth is becoming a serious bottleneck. China is rapidly expanding its electricity generation, while US data center projects are facing long interconnection queues and years of delays.The energy infrastructure angle gets especially interesting too. Gas turbines are becoming a critical bridge for AI data centers that can't wait years for new grid capacity. GE Vernova, Siemens Energy, and Mitsubishi Heavy Industries are positioned right in the middle of this trend, while turbine demand and backlogs continue to rise. GE Vernova and Siemens Energy have already seen huge gains as investors recognize just how much power the AI boom is going to require.Then there's the China problem. US restrictions on advanced AI chips may have slowed China down in the short term, but they're also pushing the country to build its own semiconductor ecosystem. SMIC is already producing advanced chips using older technology, while Chinese AI models are becoming increasingly competitive and significantly cheaper. If the gap continues to close, a potential AI price war could put pressure on the enormous spending plans that investors have already priced into the market.And this is where the stock market analysis gets really interesting. If an AI correction actually starts, the semiconductor leaders could be among the first places to look. Nvidia, Broadcom, Micron, AMD, Intel, Qualcomm, Marvell, and other major chip stocks could provide an early warning. Nvidia is especially important because of its enormous market cap weighting in the S&P 500. After an explosive move, Nvidia has now been struggling around the same levels it traded at months ago, creating a frustrating and choppy environment for traders.✅ AI bubble risks, power constraints, and data center demand✅ Nvidia, Broadcom, Micron, AMD, Intel, and semiconductor analysis✅ GE Vernova, Siemens Energy, and the AI power infrastructure boom✅ China, AI chips, SMIC, and growing competition in artificial intelligence✅ AI valuations, market concentration, order blocks, momentum, and riskIf you've been wondering whether the AI boom is getting overheated… this one is worth watching. The technology might continue changing the world, but that doesn't mean every AI stock can keep going up forever. Sometimes the biggest warning signs are hiding underneath the story everyone is excited about.Video Link:https://www.youtube.com/watch?v=PMwIW8ZT69o&t=692sSubscribe to OVTLYR for disciplined trading strategies that actually make sense. 👉 https://www.youtube.com/@ovtlyrdotcom#StockMarket #AIStocks #Nvidia #NVDA #SemiconductorStocks #TradingStrategy #OVTLYR #SwingTrading #AI #ArtificialIntelligence #TechnicalAnalysis #MarketAnalysis #RiskManagement #InvestingHere's how we plan to DOMINATE the US Investing Championship for 2026You can see our step by step trading plan developed by a team of over 20 quants for FREE by clicking here: https://www.ovtlyr.com/usicplan
Are you looking to save time, make money, and start winning with less risk? Then head to https://www.ovtlyr.com.Learn more about OVTLYR: https://youtu.be/TUCbD5KovlcHere's how we plan to DOMINATE the US Investing Championship for 2026You can see our step by step trading plan developed by a team of over 20 quants for FREE by clicking here: https://www.ovtlyr.com/usicplanThe market is setting up for a potentially important Monday—and these seven stocks could be right in the middle of it.In today’s OVTLOOK, Christopher Uhl breaks down the market setup and the key signals to watch in MU, AMD, MSFT, AAPL, TSLA, INTC, and CRWD before the opening bell.Wall Street is focused on headlines. We’re focused on trend, market breadth, sector leadership, risk, and the opportunities hiding beneath the surface.In this video, you’ll discover:• The overall market setup heading into Monday• Which sectors and stocks are showing strength or weakness• What to watch in MU, AMD, MSFT, AAPL, TSLA, INTC, and CRWD• How to prepare a trading plan without chasing emotion
From the publisher's feed

3,160 Listeners

3,325 Listeners

1,984 Listeners

801 Listeners

4,695 Listeners

2,030 Listeners

1,836 Listeners
380 Listeners

2,145 Listeners

2,649 Listeners

10,139 Listeners

650 Listeners

340 Listeners
72 Listeners
410 Listeners